Click on the Analytics tool option to gain a quick insight on the performance of your mobile app.On this page you can view multiple sections displaying the data for different segments of the mobile app performance. You can ascertain how well your business has performed, measure users' interactions with your content and posts, check for total sales, average order value, total sales, number of appointment requests for a given period, etc. These statistics represent the performance of your business within MyCommunity.Today application’s “Community hub”. Depending on the presented statistics, you can formulate effective strategies to grow your business more and meet your business performance targets while meeting customers demands.
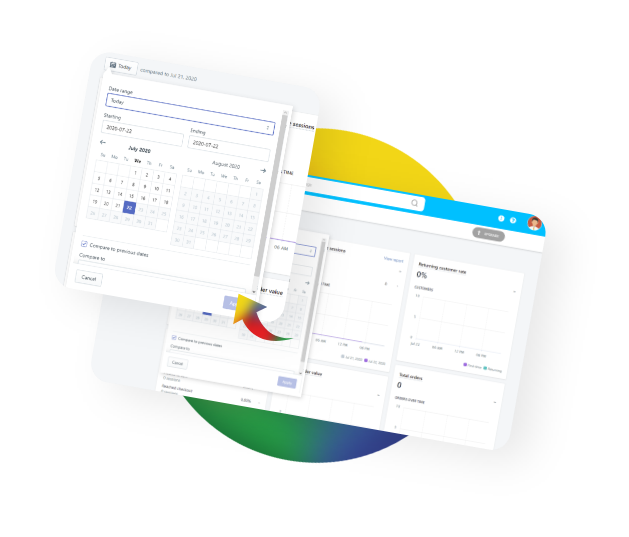
Date Range
Want to have a good overview of your business;s performance within a particular date range? Then, we’ve got you covered! It is as easy as setting the date range such as year, date to view your mobile app’s performance. Now, you can see the cumulative data for a specific period.
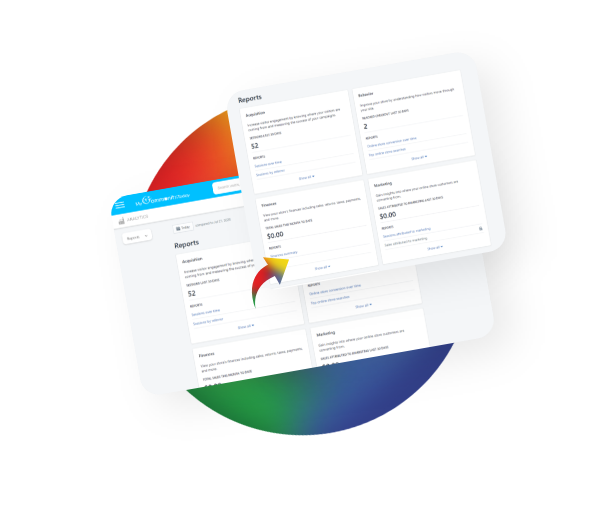
Reports
To gain a better understanding of your business's performance, take advantage of our Reports section. It will give you a clear picture of total page views, how long users lingered on a given page, which coupon or ad garnered the most attention and use, acquisition, behavior, marketing, and finances of your company. It will help you figure out the important aspects of your products and services and how your business performs in all the segments. The Reports section is beneficial for your merchants, shop owners who want to learn about in-depth analysis.
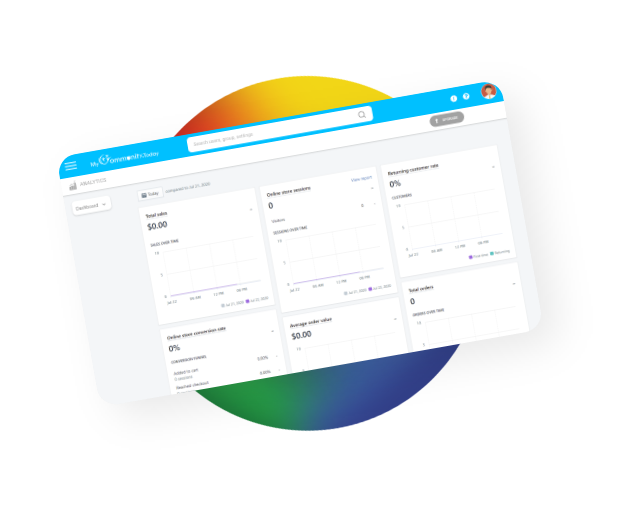
For example, our Overview dashboard shows key sales, orders, and online store visitor data. You can see at a glance how your store is performing—across all of your sales channels, and for any date range.
in the Overview dashboard you can do the following activities:
1. check the value of your recent sales and compare them to a previous time period
2. compare how well your sales channels are performing
3. track your average order value
4. see where your visitors are coming from—by region or by source
5. monitor the trends over time
The dashboard shows the most valuable metrics that give you insight into the performance of your store and the behavior of your customers. The metrics are shown in numeric format and also as graphs where appropriate. For all the metrics, the percentage change from the previous date range can also be shown.
Sign up for your business and let the sky be the only limit for your business!